[Page 1:]
[Page 2:]
PART I: AN EASY EXPLANATION OF YOUR RESULTS
Y -Chromosome Results—Location is Everything
At first glance, the numbers that make up your test results may not mean much to you. It's a lot like looking at the whorls on the pad of your finger tip, or the intricate pattern of a snowflake under a microscope. But it's a special bit of information that may hold the answer to some of your ancestral mysteries.
To determine your genetic profile, we took a look at several scientifically established DNA "location" in your Y-Chromosome test. Haplotype is the scientific term for this kind of genetic profile, and we'll call it that going forward. Your haplotype can help you find new genetic cousins and learn about your ancient ancestors. To understand where the numbers which make up your haplotype came from, imagine the DNA locations we tested as different destinations with specific addresses (location markers) on the long ribbon that is your chromosomal DNA. When we're doing your test, we travel down that ribbon, pull up to each address and write down what we find. That numeric value is always unique to your DNA, and the combination of the different values makes up the unique numbers of your haplotype.
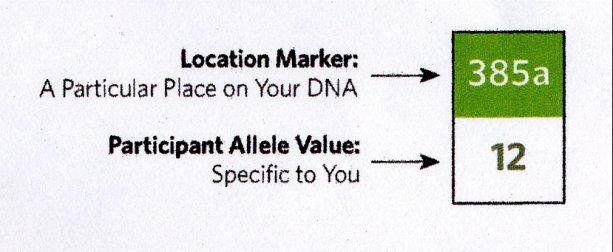
The haplotype table on your certificate has two rows. The top row, labeled "location," indicates the names of the defined markers for each of the locations (like 385a). We've filled in a numeric value for you at each of these locations, which you can see in the second row, labeled "value".
Your DNA haplotype results are useful only for our database to match you with possible genetic cousins and tell you about your ancient ancestors. Your test results don't tell you (or us!) anything about your hair color or other personal characteristics. The way we use DNA is very different from what you may have seen on TV or heard about in the past. If you're interested in learning more about the science behind the test, read Part II of this packet, Digging Deeper.
Haplotypes—Play the Matching Game
Comparing your haplotype with another participant's is an objective and accurate way to determine the range of generations in which you and that
[Page 3:]
participant may have shared a common ancestor.
Our database automatically compares your results with all other participants and lets you know about possible matches. Even if you have only a few close matches now, we automatically compare your results against each new entry in our continually growing database.
Your list of matches starts with participants who are most closely related to you. You'll be able to view the general home locations of participants in a map like the one on page 1 and see matches between 2-70 generations, as well as an estimate of the Most Recent Common Ancestor (MRCA) that you share with your matches. Your MRCA is an approximate number of years since you had a direct ancestor in common. An ancestor match of "approximately 550 years ago" could mean you shared a great-greatgreat-great-great-great grandfather.
Genetic Cousins—Exploring the Possibilities
You can unlock your new connections whenever you like, Visit your results on dna.ancestry.com and click on the "Paternal Matches" button, then click on the names of matching participants to see how you are related. We'll notify you by email when a new participant matching your haplotype is added to our database.
When you find a match, you can contact your genetic cousins and compare family trees using the secure Ancestry.com Connection Service to protect your email address. If you're fortunate, our common ancestor analysis will narrow your search to a time frame, and together, you and your genetic cousin will discover the ancestor who joins your two family trees.
You may be contacted by someone as well. An opportunity to collaborate with your genetic cousins depends on the level of participation you designate online. You may elect to share only your contact name with others or remain entirely anonymous. These preferences are available under "My Account".
Your Ancient Ancestors—Where It All Started
We determine your haplogroup based on your haplotype. Your haplogroup then gives you clues about the life and times of your ancient ancestors from tens of thousands of years ago.
Starting from the point in human history when many ancient ancestral groups migrated out of Africa, discrete populations began to settle in different parts of the world. Over generations, as they adapted to their unique environments, each population's genes became slightly different from the original African group. Some of those differences were random, while others provided genes for characteristics which let groups thrive in their environments. Taken together, those genetic differences define haplogroups.
Your haplogroup is described by a letter, A through T. Numbers and lowercase letters may also subdivide your haplogroup. Everyone in a haplogroup shares a certain number of values at definitive locations on their Y-chromosomal DNA. We took a look at those locations on your DNA and matched you to a haplogroup.
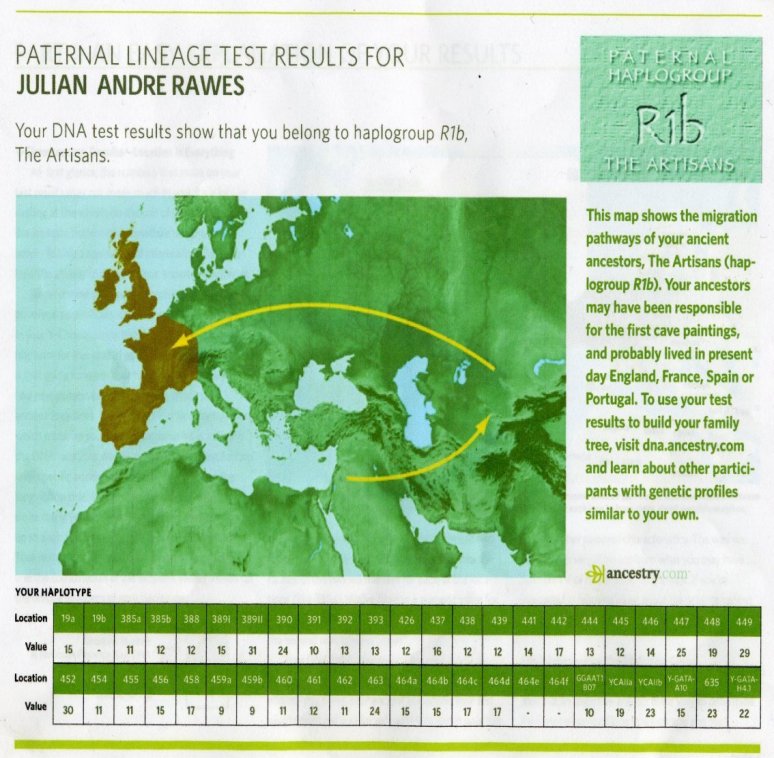
The Artisans—Haplogroup Rib
You belong to haplogroup Rib, The Artisans, who first arrived in Europe from west Asia about 35,000-40,000 years ago at the dawning of the Aurignacian culture. This cultural was remarkable for its subtle yet significant technological progress, like the shift from
[Page 4:]
random flint collection to the use of a single stone core to shape flint tools as needed. Aurignacian decorative beads and jewelry could also be the first sign we have of the uniquely human quality of self-awareness and adornment, Additionally, some anthropologists believe that the Aurignacian culture was the first to paint, Either way, the people of this time period left behind fascinating cave paintings in France, Spain and Portugal.
Other experts believe that the Perigordian culture was prevalent at the time when the Artisans first arrived in Europe. This culture distinguished itself with different technological advances, such as denticulate tools with saw-tooth notches for cutting meat or wood and for smoothing and polishing.
There are several known subgroups of Rib. We're not yet able to tell you which (if any) of these subpopulations you match to, so we'll tell you a little about a few of them. Population genetics is a rapidly advancing field, and new data may allow us to match your DNA to a specific subgroup in the future. We'll notify you by email if more advanced results become available.
One subgroup of the Artisans, R1b3 (sometimes called R1bic) is associated with the Cro-Magnons. Based on archaeological excavations, particularly in France, it's believed that the Cro-Magons wove clothes, built huts and painted.
The Ice Age may have played a role in the dispersion of the Artisans. At the peak of the Ice Age a European ice shelf extended as far as southern Ireland, mid England and northern Germany, completely covering Scandinavia. Most of continental Europe was tundra and the land only supported trees as far south as southern France, northern Italy and areas north of the Balkans and across the Black Sea. Thus, the Artisans most likely moved south of the tree line for their resources, making permanent homes where their descendants remained even when the ice shelf receded. Others returned north once resources were again available.
About 70% of individuals currently residing in southern England are members of the Artisans. Other members can be found at high rates in the modern day populations of Spain, Portugal, France, Wales, Scotland and Ireland. Based on this observation and other archeological and historical information, it is likely that your ancient ancestors also populated these areas. The Artisans include a genetic group known as the Atlantic Modal Haplotype (AM H), which features greatly among the Irish and Welsh populations.
[Page 5:]
PART II: DIGGING DEEPER
Some researchers believe that the genes associated with the AMH moved with the early Celtic migrations. Although ancient ancestral Celts were a diverse group and varied in many ways, certain mythologies are consistent throughout most Celtic traditions, despite geographic or tribal boundaries. More than 300 Celtic deities have been described, many of which are reflected in classic Roman counterparts. The god Lugh (or Lugus) may have played an important role among those deities. Folklore and storytelling has infused Lugh's character with magic and fantasy, given him credit for thunder and lightening, and placed his stage in the sky.
The widespread acceptance of Lugh in Celtic culture is supported by the use of his name as the root of city names. Lyon, the present day city in southeastern France was called Lugdunum in Roman times. The city of Leiden in south Holland may also have its roots in the name of the god.
Rlblc4 and Rlblc6 are very specific Artisan subsections found primarily in Basque populations, but also in Catalan, Spanish, French, British and German populations.
A unique modern day population, the Basque people self-identify as a discrete ethnic group in north-central Spain and southwestern France. Early Basque culture was basically democratic and their pre-Christian religion was formed around a superior female goddess, Mari. A rich mythology of Basque creatures and characters includes imps, giants, dragons, soothsayers and other nature-based deities. Traditional Basque cuisine was dictated by the mountains and sea surrounding Basque country. Lamb, fish and beans are typical ingredients of a Basque meal. The language associated with the Basque people is euskara, which linguists believe exists in a family by itself, and is not related to English or other western European languages.
Members of the Artisans can be found at high rates in South America. Populations geneticists ascribe this finding to the movement of peoples from Iberia to South America over the last 500 years.
PART II: DIGGING DEEPER
Your DNA Test: Why Y? Thank Dad.
Everyone has 46 chromosomes, grouped into 23 pairs. One pair is the sex chromosomes, which, among other things, determine gender. All women have a pair of X chromosomes (one from each parent). And all men have an X chromosome from mom and a Y chromosome that passes essentially unchanged from father to son, making it ideal for tracing paternal lineage. In many cultures, the surname is also passed from father to son. This fortunate coincidence is what makes tracing your paternal lineage through genetic similarities so powerful for genealogy.
Location markers on the Y chromosome from your DNA sample were analyzed and compared against other Ancestry.com participants' results to automatically find people closely related to you. So, the first application of your results is to contact
[Page 6:]
possible relatives you wouldn't have otherwise known about. See page 2 for more about how to do this through our service. Additionally, if your traditional genealogy work has led you to potential living relatives—particularly those who share your surname—and you'd like to confirm a connection with those individuals, encourage them to take a Y-DNA test as well. Comparing your results will provide you with an objective and scientific basis for confirming your familial ties.
Alleles & Location Markers—the DNA Details What is it that makes your information unique? And if it's so unique, why do other people have some of the same information?
Imagine your DNA as a long set of Morse code instructions. Just like one "short" signal and one "long" signal give you a Morse code value (A), your DNA repeats its "signal" in unique ways. Your haplotype has different values based on the number of times your DNA repeats its code in the different locations.
The numeric value given for each location represents a count of repeating sequences of DNA building blocks called bases. DNA is comprised of four bases: Adenine (A), Cytosine (C), Guanine (G), and Thymine (T). Those four bases line up to create a code, much like the kind of code computer programmers use.
Your Y-chromosome test measures the pattern of base repeats in your DNA code at specific locations. For example, a pattern of AACG AACG AACG would result in a value of "3", because the sequence "AACG" repeats three times.
Your test results, therefore, represent a unique pattern of repeating DNA which is inherited from your paternal lineage.
We record the DNA repeats in each of either 33 or 46 locations—depending on which DNA test you chose—and end up with a very rich message which is your haplotype. Because we look at so many locations, we have many points of comparison. You may match with someone in 15 different locations and you'll would still have 18 or 31 values which are unique to you. By looking at so many different locations, we can say something about the degree to which you match with another participant. So, are you related? You get more than a "yes" or "no" answer.
When comparing haplotypes, your closest matches will differ at fewer than 2 or 3 marker locations. A "good" match will yield a likely common ancestor only a few generations back. But you can match up to someone at fewer locations and stilldiscover that you're part of the same haplogroup; your common ancestor may have lived tens of thousands of years ago, or at any point in between.
Rates of Mutation—The Brains Behind Matching
Figuring out how your haplotype matches up with someone else's is more involved than a simple one-to-one comparison of location values. Each of the haplotype locations has a value which is unique to you. And finding that same value at that same location on someone else's haplotype is meaningful. But matching certain location values can be more significant than matching at others.
Why's that?
Certain bits of DNA are passed along relatively untouched from father to son, but other bits of DNA tend to change (mutate) each time they are passed down. The changes are completely harmless, but they're still identifiable. So the DNA at some of the locations we look at tends to change a lot from generation to generation, while DNA at other locations changes very little when it's passed along from father to son. Although they can't know how the DNA will change, scientists do know the constant rate at which DNA changes at each of the locations. And every location has a different rate of change.
A match in two participant results at a location known to have a high rate of change indicates a closer relationship than a match at a location known
[Page 7:]
to have a low rate of change. Statisticians and geneticists have figured out fairly exact odds for change (mutation rates) in the DNA in each of the locations. By using those odds in a calculation, we can tell you just how meaningful a match is, and how closely related you are to another participant.
We're constantly updating our data and statistics to keep them as current as research allows, giving you the most precise matching information available.
MRCA—A Potential Link MRCA stands for Most Recent Common Ancestor. It's an important genealogical term and gives you an idea of how many generations in the past you and another participant may have shared an ancestor. MRCA calculations are based on the number of location markers tested (either 33 or 46), the number of matching values, and the mutation rate of the markers. This provides you with a starting point from which you can compare respective family pedigrees with other participants to discover if you indeed share an identical ancestor.
Our MRCA report provides a confidence range from 50% to 95%. At 50% confidence, you have an equal chance that the generational range might be greater than what is stated. The higher the confidence level is set, the broader the generational range. This information can spark a new trail to a branch of yourfamily tree or confirm or negate a lead you already had. See Part I for more about how to apply your results to build your family tree.
Still Have Questions?
If you have questions about your results, the science behind our tests, or how to connect with potential matches, our website's live chat and email features allow you to contact us directly. For more information, visit our blog at dna.ancestry.com and visit the Ancestry.com Learning Center to see videos about our services.
Notes:-
Test carried out in December 2008.